Abstract
This study examined the barriers to livelihood diversification and welfare outcomes of artisanal fishing households along Shiroro and Kainji dams, Nigeria and welfare outcomes of artisanal fishing households along Shiroro and Kainji dams. A cross-sectional survey of 300 fishers across 50 villages was conducted, with data analyzed using Exploratory Factor Analysis (EFA) and the Simpson Diversification Index (SDI). Economic constraints high cost of fishing gear (72.0%), limited access to credit (72.7%), and inadequate operating capital (71.0%) were the most severe factors affecting livelihoods. Institutional challenges, including limited extension services (52.7%) and inadequate training (49.0%), alongside environmental stressors such as seasonal water-level fluctuations (36.3%) and climate variability (36.3%), also influenced outcomes. EFA identified Economic Welfare (Factor 1), comprising fishing income (0.82), income from other activities (0.79), and household expenditure (0.75), as the most influential determinant of well-being. Access to services (Factor 2), Food Security (Factor 3), and Asset Ownership (Factor 4) further shaped household welfare. Livelihood diversification was high (SDI = 0.955), dominated by arable farming (59.3%), poultry (50.2%), and livestock (45.9%) and supplemented by petty trading, night guarding, and small-scale processing. The study concludes that diversified livelihoods help households mitigate risks from declining fish stocks and environmental variability. Policy interventions promoting financial inclusion, access to affordable inputs, institutional support, and market development are essential for sustaining welfare and fostering resilient artisanal fisheries.
|
Published in
|
Ecology and Evolutionary Biology (Volume 11, Issue 3)
|
|
DOI
|
10.11648/j.eeb.20261103.11
|
|
Page(s)
|
41-50 |
|
Creative Commons
|

This is an Open Access article, distributed under the terms of the Creative Commons Attribution 4.0 International License (http://creativecommons.org/licenses/by/4.0/), which permits unrestricted use, distribution and reproduction in any medium or format, provided the original work is properly cited.
|
|
Copyright
|
Copyright © The Author(s), 2026. Published by Science Publishing Group
|
Keywords
Artisanal Fisheries, Barriers, Livelihood Diversification, Simpson Diversification Index, Household Welfare,
Shiroro and Kainji Dams
1. Introduction
Artisanal fisheries constitute a critical component of rural livelihoods in many developing countries, providing employment, food security, and income to millions of households
| [10] | Organisation for Economic Co-operation and Development (OECD). (2023). OECD Review of Fisheries 2023: Policies and Summary Statistics. OECD Publishing.
https://doi.org/10.1787/fd0d7de0-en |
[10]
. In Nigeria, inland reservoir systems such as Shiroro and Kainji dams support substantial artisanal fishing communities whose economic survival is intricately linked to fish availability and the broader socio-ecological context of the reservoirs. Beyond fishing, households often engage in multiple livelihood activities, reflecting adaptive strategies to manage risk, diversify income, and ensure food security
. Livelihood diversification in artisanal fishing communities is influenced by a combination of structural, economic, and environmental factors. Structural constraints, including limited access to credit, inadequate extension services, poor regulatory enforcement, and inadequate infrastructure, can restrict the capacity of households to diversify their income sources effectively
| [3] | Béné, C., Macfadyen, G., & Allison, E. H. (2020). Increasing the contribution of small-scale fisheries to poverty alleviation and food security. Fish and Fisheries, 21(5), 1037–1057.
https://doi.org/10.1111/faf.12419 |
[3]
. Environmental stressors, such as climate variability, declining fish stocks, and water pollution, further exacerbate household vulnerability, compelling fishers to adopt a variety of coping strategies to maintain welfare
| [2] | Allison, E. H., Perry, A. L., Badjeck, M.-C., Adger, W. N., Brown, K., Conway, D., Halls, A. S., Pilling, G. M., Reynolds, J. D., & Andrew, N. L. (2022). Climate change impacts on small-scale fisheries. Global Environmental Change, 73, 102470. https://doi.org/10.1016/j.gloenvcha.2021.102470 |
[2]
. The interplay between structural constraints, livelihood diversification behaviour, and welfare outcomes remains a critical yet under-examined area in inland fisheries research. While existing studies have documented the socio-economic characteristics of artisanal fishers, there is limited empirical evidence on how structural limitations shape diversification strategies and, in turn, influence household welfare outcomes in Nigerian reservoir systems. Understanding this dynamic is essential for designing targeted interventions that enhance resilience, reduce vulnerability, and promote sustainable livelihoods.
Moreover, the livelihoods of artisanal fishers in inland reservoir systems are increasingly shaped by socio-economic transformations and environmental pressures. Urbanization, population growth, and changing market demands have altered the availability of fishing resources and the profitability of traditional fishing activities, compelling households to engage in multiple complementary occupations
| [4] | Belton, B., Little, D. C., Zhang, W., Edwards, P., Skladany, M., & Thilsted, S. H. (2021). Farming fish in a changing world: Aquaculture and resilience. Global Food Security, 30, 100563. https://doi.org/10.1016/j.gfs.2021.100563 |
| [6] | Gephart, J. A., Henriksson, P. J. G., Parker, R. W. R., Shepon, A., Gorospe, K. D., Bergman, K., Eshel, G., Golden, C. D., Halpern, B. S., Hornborg, S., Jonell, M., Metian, M., Mifflin, K., Newton, R., Tyemers, P., Troell, M., & Davis, K. F. (2021). Environmental performance of blue foods. Nature, 597(7876), 360–365. https://doi.org/10.1038/s41586-021-03889-2 |
[4, 6]
. Simultaneously, climate variability, fluctuating water levels, and seasonal changes in fish abundance exacerbate household vulnerability, particularly for those with limited access to capital or alternative income sources
| [5] | FAO. (2024). The State of World Fisheries and Aquaculture 2024: Blue Transformation in Action. Food and Agriculture Organization of the United Nations.
https://doi.org/10.4060/cd0683en |
[5]
. These dynamics underscore the necessity of examining not only the patterns of livelihood diversification but also the structural and institutional factors that enable or constrain household adaptive capacity. By exploring how structural constraints influence diversification behaviour and subsequent welfare outcomes, this study provides critical insights for policy interventions aimed at promoting sustainable livelihoods and resilience in Nigerian inland fisheries.
2. Statement of the Problem
Despite the recognized importance of artisanal fisheries for rural livelihoods, households in inland reservoir systems face persistent structural and socio-economic constraints that threaten both productivity and welfare. Key challenges include limited access to finance, inadequate fishing and processing technologies, insufficient extension support, weak market linkages, and environmental degradation
. These constraints not only restrict fishing efficiency but also hinder the ability of households to engage in alternative livelihood activities effectively, limiting their capacity to diversify income and manage risk. Previous studies have focused primarily on the economic or ecological dimensions of artisanal fisheries, with limited attention to the interconnected effects of structural constraints on diversification behaviour and welfare outcomes. Consequently, there is inadequate empirical evidence to inform policies aimed at improving the resilience of fishing households in Nigeria’s reservoir systems. Without a clear understanding of how structural factors influence livelihood diversification and welfare, interventions risk being fragmented, inefficient, or unsustainable. This study seeks to fill this gap by examining the relationships among structural constraints, livelihood diversification behaviour, and welfare outcomes of artisanal fishing households along Shiroro and Kainji dams. By identifying critical constraints and evaluating their impact on livelihood strategies and household welfare, the study provides evidence for targeted interventions that can enhance resilience, improve income stability, and support sustainable management of inland fisheries resources.
3. Objectives of the Study
The broad objective of the study is to analyse the structural constraints affecting artisanal fisheries and examine how livelihood diversification strategies influence the welfare outcomes of fishing households along Shiroro and Kainji dams in Nigeria. The specific objectives:
1) identify and empirically assess the major structural, institutional, environmental, and socioeconomic constraints affecting artisanal fisheries and the livelihood outcomes of fishing households along Shiroro and Kainji dams.
2) analyse the livelihood diversification strategies adopted by artisanal fishers and evaluate their effects on household welfare outcomes in the study area.
4. Methodology
4.1. Description of Shiroro Dam
The study was carried out along Shiroro and Kainji Dams. The population of Shiroro is projected in 2020 to be 322,918 people using a 3.2% growth rate
| [11] | Sumaila, U. R., Skerritt, D. J., Schuhbauer, A., Villasante, S., Cisneros-Montemayor, A. M., Sinan, H., Burnside, D., & Abdallah, P. (2021). WTO must ban harmful fisheries subsidies. Science, 374(6567), 544–544.
https://doi.org/10.1126/science.abm1680 |
[11]
. The climate, edaphic features, and hydrology of the state where the dam is located allow sufficient opportunities for harvesting fresh water fish such as
Tilapia spp,
Bagrus spp,
Clarias spp,
Gymnarchus niloticus,
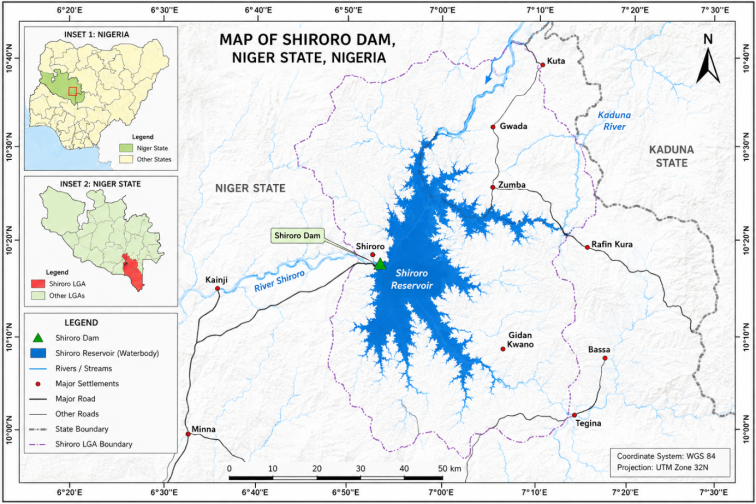
Heterotis spp, Labeo spp, Mormysus spp, Lates niloticus, etc. It also permits the cultivation of most of Nigeria's staple crops such as maize, yam, rice, millet and sorghum. The Shiroro hydropower reservoir is a storage-based hydroelectric facility located in Shiroro Local Government, Niger State, at the Shiroro Gorge, which lies approximately between Latitude 9° 57' 25N and Longitude 6° 49' 55E. It is located approximately 90 km southwest of Kaduna on River Dinya. Annual temperature around the reservoir varies between 27 and 35°C
.
Figure 1. Map of Nigeria showing Shiroro Dam.
4.2. Description of Kainji Dam
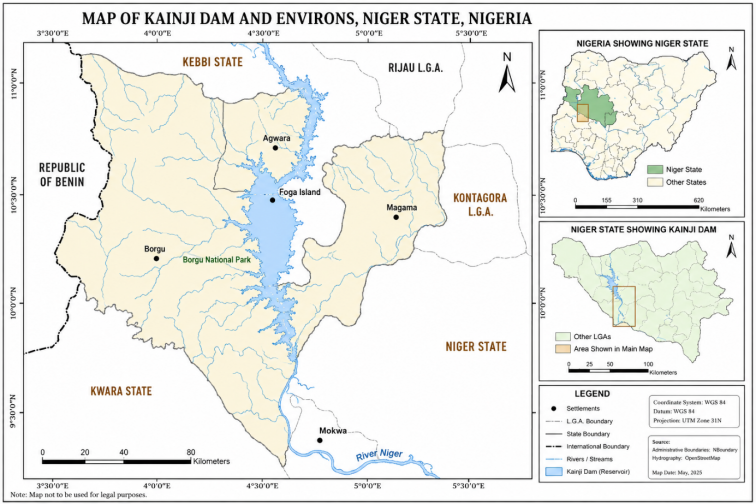
Figure 2. Map of Nigeria showing Kainji Dam.
Kainji Lake is located between latitudes 9°5’ and 10°55’N and longitudes 4°21’ and 4°45’E. It cuts across Niger and Kebbi states, but is mostly located in Niger state. Kainji is the second largest lake in Africa and the largest man-made lake in Nigeria (Hussaini, 2022). It was created in 1968 following the impoundment of the Niger River by the construction of the Kainji Dam at New Bussa, in Borgu Local Government Area of present day Niger State. The total annual rainfall for the Lake ranges between 1,100 mm and 1,250 mm, spreading from April to October (Chilaka et al., 2024). The highest (about 30°C) and lowest (about 25°C) monthly temperatures are recorded in March and August, respectively. Fishing is the major traditional occupation of these people whereas other occupations include: farming, livestock breeding and local entrepreneurship.
4.3. Method of Data Collection
Both primary and secondary data were used for the study. Primary data was obtained using a structured questionnaire designed in line with the study objectives. The questionnaires were administered to the fishers selected for the study.
4.4. Sampling Procedure and Sample Size
The study adopted a multi-stage and proportionate sampling technique. In the first stage, two major dams in the North-Central region of Nigeria where artisanal fisheries activities are widely practiced were purposively selected. These were Kainji Dam and Shiroro Dam. In the second stage, fishing villages were selected through simple random sampling. A total of 50 fishing villages were selected, comprising 30 villages from Kainji Dam and 20 villages from Shiroro Dam, reflecting the higher concentration of fishing communities around Kainji Dam. In the third stage, the sample size was determined using Yamane’s (1967) formula, given as:
Yamane’s Sample Size Determination Formula
The sample size for this study was determined using the formula
| [16] | Yamane, T. (1967). Statistics: An introductory analysis (2nd ed.). New York, NY: Harper and Row. |
[16]
as stated below:
Where:
n = required sample size
N = total population (sampling frame)
e = level of precision (sampling error), usually 0.05
where n is the sample size, N is the population size, and e is the level of precision (0.05). The total fishing population constituted the sampling frame, which comprised 3,823 fishers around Kainji Dam and 3,632 fishers around Shiroro Dam, giving a total population of 7,455 fishers. Applying Yamane’s formula yielded a sample size of 300 fishers for the study. Thereafter, a proportionate sampling technique was used to allocate the sample size between the two dams based on their respective fishing populations. Accordingly, 154 fishers were selected from Kainji Dam, while 146 fishers were selected from Shiroro Dam. The rationale for selecting a higher number of villages and respondents from Kainji Dam was due to its relatively larger number of fishing communities and fishers compared to Shiroro Dam.
Sampling Percentage
Application of the Formula
n = 7,455 / [1 + 7,455(0.05)2]
n = 7,455 / [1 + 18.64]
n = 7,455 / 19.64
n ≈ 300
Therefore, a sample size of 300 respondents was used for the study. Sampling percentage = (300 / 7,455) × 100 ≈ 4%
Hence, approximately 4% of the total fishing population was sampled.
Table 1. Sample Size allocation between Dams (Proportionate).
Dam | Fishing Population | Proportion (%) | Sample Size |
Kainji Dam | 3,823 | 51.3 | 154 |
Shiroro Dam | 3,632 | 48.7 | 146 |
Total | 7,455 | 100 | 300 |
Source: Author Construct, 2026.
4.5. Method of Data Analysis
Data collected were analyzed using inferential statistics. Exploratory Factor Analysis was used to achieve objective 1; Simpson Diversity Index (SDI) was used to achieve Objective 2.
Exploratory and Principal Factor Analysis Model Specification
Each observed variable (X) can be expressed as a combination of underlying factors (F) and a unique error term (ε):
Xi= λi1* F1+ λi2* F2+ ... + λim* Fm+ εi(1)
Where:
Xi = observed variable i (e.g., high cost of fishing gear, lack of credit)
F1, F2, ..., Fm = latent factors (economic, institutional, environmental)
λij = factor loading of variable i on factor j (strength of association)
εi = unique variance or error term of variable i
m = number of factors extracted
Note:
Factors were extracted using Principal Component Analysis (PCA).
Varimax rotation was applied for easier interpretation.
KMO and Bartlett’s tests were used to check if the data were suitable for factor analysis.
The Simpson Diversification Index (SDI) was used to achieve objective 2. The Simpson index was used to measure the diversity of strategies adopted by households in the study area. The Simpson index was used because the index is simple to compute, robust, and widely applicable. The value of the Simpson index lies between 0 and 1. The value of the index is zero when there is complete specialization, and it approaches one as the level of diversification increases.
The formula for the Simpson Diversification Index is given as:
Where SDI is the Simpson Diversification Index, N is the total number of livelihood sources. The values of SDI range from 0 to 1, where 0 depicts no diversification (complete specialization), and it approaches 1 as the level of diversification increases. Based on the SDI values, the level of livelihood diversification is defined as:
No diversification (SDI = 0)
Low level of diversification (SDI = 0.00001 - 0.2500.
Medium level of diversification (SDI=0.2501-0.4500)
High level of diversification (SDI= >0.4501)
5. Results and Discussion
Table 2. Prevalence and Severity of Constraints Affecting Artisanal Fisheries along Shiroro and Kainji Dams (N = 300).
Constraint Category | Key Constraint Indicators | Highly Severe (%) | Moderately Severe (%) | Not Severe (%) |
Economic & Financial | High cost of fishing gear | 72.0 | 21.7 | 6.3 |
| Lack of access to credit | 72.7 | 19.3 | 8.0 |
| Inadequate operating capital | 71.0 | 20.0 | 9.0 |
| High fuel/operating costs | 66.3 | 23.0 | 10.7 |
| Low fish income | 63.7 | 25.0 | 11.3 |
Institutional & Technical | Limited extension services | 52.7 | 31.0 | 16.3 |
| Lack of modern fishing technology | 51.7 | 30.3 | 18.0 |
| Inadequate training/skills | 49.0 | 31.7 | 19.3 |
| Weak cooperatives | 46.3 | 32.7 | 21.0 |
| Weak enforcement of regulations | 44.3 | 33.0 | 22.7 |
Environmental & Physical | Seasonal water-level fluctuations | 36.3 | 34.0 | 29.7 |
| Climate variability/extreme weather | 36.3 | 33.7 | 30.0 |
| Water pollution | 34.4 | 34.3 | 31.3 |
| Invasive aquatic plants | 31.3 | 35.0 | 33.7 |
| Safety/insecurity on water | 29.0 | 35.0 | 36.0 |
Source: Field Survey, 2025.
The findings in
Table 2 indicate that constraints affecting artisanal fisheries along Shiroro and Kainji dams are multidimensional, encompassing economic and financial, institutional and technical, and environmental and physical domains. The analysis of 300 respondents highlights the severity and prevalence of these constraints across different dimensions of livelihood.
5.1. Economic and Financial Constraints
Economic and financial barriers emerged as the most severe constraints for artisanal fishers. Specifically, 72.0% of respondents identified the high cost of fishing gear as highly severe, 72.7% reported lack of access to credit, and 71.0% cited inadequate operating capital. Additional economic constraints include high fuel and operating costs (66.3%) and low income from fish sales (63.7%). These figures underscore that limited financial resources and high operational costs remain the most critical factors restricting productivity and household income. The predominance of economic constraints reflects broader structural issues in inland fisheries, where access to affordable inputs, credit facilities, and stable market channels is limited
. The high prevalence of these constraints suggests that household-level investment capacity is a critical determinant of livelihood outcomes, and that interventions aimed at reducing input costs or increasing financial access could significantly improve fishers’ welfare.
5.2. Institutional and Technical Constraints
Institutional and technical factors also significantly influence artisanal fisheries, although their severity is generally lower than that of economic constraints. Limited extension services were reported as highly severe by 52.7% of respondents, lack of modern fishing technology by 51.7%, and inadequate training and skills by 49.0%. Weak cooperative organizations (46.3%) and poor enforcement of fishing regulations (44.3%) further exacerbate challenges, while inadequate policy support was identified as highly severe by 43.7% of respondents. These findings are consistent with prior studies demonstrating that insufficient institutional support, lack of regulatory enforcement, and weak cooperative structures limit the adoption of modern fishing practices and sustainable resource management
| [14] | Ye, Y., Cochrane, K., Bianchi, G., Willmann, R., Majkowski, J., & Tandstad, M. (2022). Rebuilding global fisheries: The World Bank and FAO perspective. Marine Policy, 138, 104992. https://doi.org/10.1016/j.marpol.2022.104992 |
[14]
. The data suggest that enhancing institutional capacity through effective extension services, cooperative strengthening, and better regulatory enforcement is essential for improving productivity and fostering sustainable fisheries management.
5.3. Environmental and Physical Constraints
Environmental and physical constraints, while relatively less severe, remain important determinants of livelihood vulnerability. Seasonal water-level fluctuations and climate variability were each reported as highly severe by 36.3% of respondents, water pollution by 34.4%, and invasive aquatic plants by 31.3%. Safety and insecurity on the water was reported as highly severe by 29.0% of respondents. These findings indicate that inland fisheries are highly sensitive to environmental and ecological stressors, which can reduce fish availability, limit access to fishing grounds, and threaten household income stability. The interaction between environmental stress and socioeconomic vulnerability magnifies livelihood risks, particularly for households that are heavily dependent on fishing as their primary source of income
.
5.4. Integrated Analysis
The overall analysis demonstrates that economic constraints exert the strongest influence on livelihood outcomes, followed by institutional and environmental factors. The high percentage of respondents experiencing severe economic constraints reflects the centrality of financial capacity in determining household resilience. Institutional weaknesses impede the uptake of improved technologies and practices, limiting the potential for economic gains even when resources are available. Environmental constraints, while less severe, interact with economic and institutional limitations to create compounded risks for artisanal fishers. These findings suggest that addressing livelihood challenges in artisanal fisheries requires a multidimensional approach.
Table 3. Principal Factor Analysis of Welfare Outcomes among Artisanal Fishing Households (N = 300).
Welfare Indicator | Factor 1: Economic Welfare | Factor 2: Access & Services | Factor 3: Food Security | Factor 4: Asset Ownership |
Monthly income from fishing | 0.82 | 0.12 | 0.10 | 0.05 |
Monthly income from other activities | 0.79 | 0.18 | 0.12 | 0.08 |
Total household expenditure | 0.75 | 0.15 | 0.20 | 0.10 |
Number of meals per day | 0.10 | 0.12 | 0.85 | 0.05 |
Protein consumption frequency | 0.12 | 0.10 | 0.83 | 0.02 |
Access to clean water | 0.08 | 0.81 | 0.12 | 0.05 |
Access to health services | 0.15 | 0.79 | 0.10 | 0.08 |
Child school attendance | 0.12 | 0.80 | 0.10 | 0.06 |
Ownership of boat/canoe | 0.05 | 0.10 | 0.08 | 0.88 |
Ownership of fishing gear | 0.10 | 0.08 | 0.05 | 0.85 |
Household savings | 0.78 | 0.12 | 0.11 | 0.09 |
Access to microfinance | 0.75 | 0.18 | 0.12 | 0.08 |
Quality of housing | 0.08 | 0.80 | 0.10 | 0.06 |
Livestock ownership | 0.12 | 0.10 | 0.82 | 0.05 |
Crop production | 0.14 | 0.12 | 0.79 | 0.08 |
Fishing equipment availability | 0.10 | 0.08 | 0.10 | 0.86 |
Number of productive assets | 0.10 | 0.10 | 0.05 | 0.87 |
Household members with education | 0.12 | 0.79 | 0.10 | 0.05 |
Household access to electricity | 0.15 | 0.80 | 0.12 | 0.06 |
Transportation facilities | 0.10 | 0.78 | 0.10 | 0.08 |
Food storage and preservation | 0.12 | 0.10 | 0.81 | 0.05 |
Ownership of processing equipment | 0.08 | 0.12 | 0.10 | 0.85 |
Participation in cooperatives | 0.10 | 0.79 | 0.12 | 0.08 |
Access to market information | 0.12 | 0.80 | 0.10 | 0.06 |
Frequency of food shortages | 0.05 | 0.08 | 0.84 | 0.05 |
Healthcare expenditure | 0.10 | 0.78 | 0.12 | 0.07 |
Source: Field Survey, 2026 Factor loadings >0.4 are considered significant. Indicators are assigned to the factor with the highest loading.
The Principal Factor Analysis reveals that welfare among artisanal fishing households is multidimensional, structured around four latent factors: economic welfare, access to services, food security, and asset ownership. Economic Welfare (Factor 1): Indicators such as monthly income from fishing (0.82), income from other activities (0.79), total household expenditure (0.75), and household savings (0.78) load heavily on this factor. This demonstrates that financial capacity remains a critical determinant of welfare, supporting findings by
| [15] | Zhang, W., Belton, B., Edwards, P., Henriksson, P. J. G., Little, D. C., Newton, R., Troell, M., & Phillips, M. J. (2022). Aquaculture will continue to depend on capture fisheries for nutrients. Nature Food, 3(1), 57–63.
https://doi.org/10.1038/s43016-021-00438-6 |
[15]
, who highlighted income variability and capital constraints as central challenges for inland artisanal fishers.
Access & Services (Factor 2): Access to clean water (0.81), health services (0.79), child school attendance (0.80), and household electricity (0.80) cluster under this factor, indicating that social infrastructure and service provision significantly shape household well-being. These results align with Allison et al. (2022), emphasizing that welfare is not solely economic but depends on access to essential services. Food Security (Factor 3): Nutritional indicators such as number of meals per day (0.85), protein consumption frequency (0.83), livestock ownership (0.82), and crop production (0.79) load strongly on this factor. This underscores that dietary quality and food availability are major components of welfare, corroborating findings by
| [10] | Organisation for Economic Co-operation and Development (OECD). (2023). OECD Review of Fisheries 2023: Policies and Summary Statistics. OECD Publishing.
https://doi.org/10.1787/fd0d7de0-en |
[10]
regarding inland fishers’ reliance on diversified livelihoods to ensure household nutrition.
Asset Ownership (Factor 4): Ownership of boats (0.88), fishing gear (0.85), and processing equipment (0.85) reflects the importance of productive assets in determining livelihood stability. Households with more assets are better positioned to buffer economic shocks, consistent with
. Integrated Implication: The analysis confirms that structural constraints, diversification strategies, and asset accumulation jointly influence welfare outcomes. Economic interventions alone are insufficient; access to social services, food security measures, and productive asset provision are equally crucial. This multidimensional understanding allows policymakers to design holistic interventions that enhance resilience, income stability, and long-term sustainability of artisanal fishing households.
Table 4. Livelihood Diversification Strategies and Simpson Index Results of Artisanal Fishers along Shiroro and Kainji Dams (N = 300).
Livelihood Activity | No. of Households (N) | Percentage (%) | n-1 | N_i (N_i-1) |
Arable farming | 178 | 59.3 | 177 | 31,506 |
Poultry rearing | 155 | 50.2 | 154 | 23,870 |
Livestock rearing | 138 | 45.9 | 137 | 18,906 |
Night guard | 93 | 31.0 | 92 | 8,556 |
Hunting | 92 | 30.7 | 91 | 8,372 |
Processed agricultural products | 84 | 27.8 | 83 | 6,972 |
Petty trading | 80 | 26.5 | 79 | 6,320 |
Grinding | 70 | 23.3 | 69 | 4,830 |
Milling of grains | 66 | 22.2 | 65 | 4,290 |
Shoe making | 64 | 21.3 | 63 | 4,032 |
Tailoring | 62 | 20.7 | 61 | 3,782 |
Water trading | 62 | 20.7 | 61 | 3,782 |
Carpentry | 61 | 20.4 | 60 | 3,660 |
Butchery | 61 | 20.4 | 60 | 3,660 |
Tree crop planting | 61 | 20.2 | 60 | 3,660 |
Barbing | 60 | 20.0 | 59 | 3,540 |
Transportation | 53 | 17.6 | 52 | 2,756 |
Cassava processing | 50 | 16.7 | 49 | 2,450 |
Food vending | 41 | 13.5 | 40 | 1,640 |
Blacksmithing | 38 | 12.8 | 37 | 1,406 |
LGA civil service | 34 | 11.3 | 33 | 1,122 |
Security operative | 27 | 9.1 | 26 | 702 |
Vulcanizing | 27 | 8.9 | 26 | 702 |
Teaching | 26 | 8.7 | 25 | 650 |
Nursing | 13 | 4.3 | 12 | 156 |
Total | 1,690 | - | 1,678 | 128,000 |
Source: Field Survey, 2026.
The combined analysis of livelihood activities and the Simpson Index results in
Table 4 reveals that artisanal fishing households along Shiroro and Kainji dams maintain highly diversified livelihood portfolios. The Simpson Index value of 0.955 indicates that households are spreading economic risk across multiple activities, consistent with adaptive livelihood strategies observed in small-scale fisheries globally
| [1] | Adepoju, A. A., Ogunleye, T., & Bello, H. (2022). Livelihood diversification among artisanal fishers in Nigeria: Strategies and outcomes. Fisheries Research, 250, 106345.
https://doi.org/10.1016/j.fishres.2022.106345 |
| [9] | Nash, K. L., Blythe, J. L., Cvitanovic, C., Fulton, E. A., Halpern, B. S., Milner-Gulland, E. J., & Watson, R. A. (2022). To achieve a sustainable blue future, progress assessments must include interdependencies between the Sustainable Development Goals. One Earth, 5(2), 148–156.
https://doi.org/10.1016/j.oneear.2022.01.008 |
[1, 9]
. Agriculture remains the primary source of livelihood, with arable farming (59.3%), poultry rearing (50.2%), and livestock rearing (45.9%) dominating household economic activity. These findings suggest that households rely heavily on farm-based activities to stabilize income and ensure food security, complementing income from fishing. Similar observations have been reported in inland fisheries across Nigeria, where diversification into crop and livestock production mitigates risks associated with declining fish stocks and income variability
| [7] | Kolding, J., van Zwieten, P. A. M., & Mkumbo, O. C. (2021). Small-scale inland fisheries in Africa: Diversification strategies and resilience. Aquatic Living Resources, 34, 12.
https://doi.org/10.1051/alr/2021020 |
[7]
.
The data also show a secondary cluster of non-farm activities, including night guarding (31.0%), hunting (30.7%), and sales of processed agricultural products (27.8%), which serve as supplementary income streams. Petty trading (26.5%) and small-scale processing activities, such as grinding and milling (22–23%), illustrate the role of informal entrepreneurial activities in household resilience. The Simpson Index captures this distribution, confirming that households do not concentrate their efforts on a single livelihood but rather engage in multiple complementary activities to enhance economic security
| [14] | Ye, Y., Cochrane, K., Bianchi, G., Willmann, R., Majkowski, J., & Tandstad, M. (2022). Rebuilding global fisheries: The World Bank and FAO perspective. Marine Policy, 138, 104992. https://doi.org/10.1016/j.marpol.2022.104992 |
[14]
. Skill-based trades, including tailoring, carpentry, and butchery (20–21%), indicate moderate adoption of specialized income-generating activities. Formal employment, such as civil service (11.3%) or professional roles in teaching (8.7%) and nursing (4.3%), remains limited, highlighting structural barriers such as low educational attainment, lack of access to formal job opportunities, and resource constraints (Kolding
et al., 2021).
6. Conclusion
This study examined the structural constraints affecting artisanal fisheries, the livelihood diversification strategies adopted by fishing households, and the resulting welfare outcomes along Shiroro and Kainji dams in Nigeria. The findings indicate that artisanal fishers face multidimensional challenges, with economic constraints including high costs of fishing gear, limited access to credit, and inadequate operating capital being the most severe. Institutional and technical factors, such as limited extension services and weak cooperative structures, alongside environmental and physical stressors like seasonal water-level fluctuations and climate variability, further constrain household livelihoods. Despite these challenges, households engage in highly diversified livelihood strategies (SDI = 0.955), combining agriculture, non-farm activities, and skill-based trades to mitigate risk and enhance welfare. The study underscores that livelihood diversification is a key adaptive mechanism that enables fishing households to sustain income, food security, and resilience in the face of structural and environmental constraints.
7. Recommendations
Based on the findings of the study, the following recommendations were made:
1) Policies and programs should focus on improving fishers’ access to affordable credit, subsidies for fishing gear, and operational inputs. Microfinance schemes, cooperative-based lending, and low-interest credit facilities could significantly reduce economic constraints and enable households to expand and optimize their livelihood activities.
2) Extension services, technical training, and cooperative strengthening should be prioritized to improve adoption of modern fishing technologies and sustainable resource management practices. Effective institutional frameworks will support diversified livelihood strategies and increase overall household welfare.
3) Interventions should combine market development, value-chain support, and environmental management to ensure sustainable incomes. Expanding access to local and regional markets, coupled with climate-adaptive fisheries management and ecological restoration measures, will enhance resilience, income stability, and long-term sustainability of artisanal fisheries.
Abbreviations
SDI | Simpson Diversification Index |
PFA | Principal Factor Analysis |
PCA | Principal Component Analysis |
Author Contributions
Yohanna John Alhassan: Conceptualization, Data curation, Investigation, Formal analysis
Tsukutado Istifnus Isreal: Methodology, Project administration, Software, Supervision, Validation, Visualization
Cuba James: Funding acquisition, Resources, Writing – original draft, Writing – review & editing
Conflicts of Interest
The authors declare no conflicts of interest.
References
| [1] |
Adepoju, A. A., Ogunleye, T., & Bello, H. (2022). Livelihood diversification among artisanal fishers in Nigeria: Strategies and outcomes. Fisheries Research, 250, 106345.
https://doi.org/10.1016/j.fishres.2022.106345
|
| [2] |
Allison, E. H., Perry, A. L., Badjeck, M.-C., Adger, W. N., Brown, K., Conway, D., Halls, A. S., Pilling, G. M., Reynolds, J. D., & Andrew, N. L. (2022). Climate change impacts on small-scale fisheries. Global Environmental Change, 73, 102470.
https://doi.org/10.1016/j.gloenvcha.2021.102470
|
| [3] |
Béné, C., Macfadyen, G., & Allison, E. H. (2020). Increasing the contribution of small-scale fisheries to poverty alleviation and food security. Fish and Fisheries, 21(5), 1037–1057.
https://doi.org/10.1111/faf.12419
|
| [4] |
Belton, B., Little, D. C., Zhang, W., Edwards, P., Skladany, M., & Thilsted, S. H. (2021). Farming fish in a changing world: Aquaculture and resilience. Global Food Security, 30, 100563.
https://doi.org/10.1016/j.gfs.2021.100563
|
| [5] |
FAO. (2024). The State of World Fisheries and Aquaculture 2024: Blue Transformation in Action. Food and Agriculture Organization of the United Nations.
https://doi.org/10.4060/cd0683en
|
| [6] |
Gephart, J. A., Henriksson, P. J. G., Parker, R. W. R., Shepon, A., Gorospe, K. D., Bergman, K., Eshel, G., Golden, C. D., Halpern, B. S., Hornborg, S., Jonell, M., Metian, M., Mifflin, K., Newton, R., Tyemers, P., Troell, M., & Davis, K. F. (2021). Environmental performance of blue foods. Nature, 597(7876), 360–365.
https://doi.org/10.1038/s41586-021-03889-2
|
| [7] |
Kolding, J., van Zwieten, P. A. M., & Mkumbo, O. C. (2021). Small-scale inland fisheries in Africa: Diversification strategies and resilience. Aquatic Living Resources, 34, 12.
https://doi.org/10.1051/alr/2021020
|
| [8] |
Mohammed, A., & Uraguchi, Z. (2023). Adaptive livelihood strategies in inland fisheries: Evidence from Nigerian reservoirs. Marine Policy, 147, 105479.
https://doi.org/10.1016/j.marpol.2022.105479
|
| [9] |
Nash, K. L., Blythe, J. L., Cvitanovic, C., Fulton, E. A., Halpern, B. S., Milner-Gulland, E. J., & Watson, R. A. (2022). To achieve a sustainable blue future, progress assessments must include interdependencies between the Sustainable Development Goals. One Earth, 5(2), 148–156.
https://doi.org/10.1016/j.oneear.2022.01.008
|
| [10] |
Organisation for Economic Co-operation and Development (OECD). (2023). OECD Review of Fisheries 2023: Policies and Summary Statistics. OECD Publishing.
https://doi.org/10.1787/fd0d7de0-en
|
| [11] |
Sumaila, U. R., Skerritt, D. J., Schuhbauer, A., Villasante, S., Cisneros-Montemayor, A. M., Sinan, H., Burnside, D., & Abdallah, P. (2021). WTO must ban harmful fisheries subsidies. Science, 374(6567), 544–544.
https://doi.org/10.1126/science.abm1680
|
| [12] |
United Nations. (2023). The Sustainable Development Goals Report 2023. United Nations.
https://doi.org/10.18356/9789210024914
|
| [13] |
World Bank. (2023). The Blue Economy: Development Framework for Sustainable Growth. World Bank.
https://doi.org/10.1596/978-1-4648-1958-1
|
| [14] |
Ye, Y., Cochrane, K., Bianchi, G., Willmann, R., Majkowski, J., & Tandstad, M. (2022). Rebuilding global fisheries: The World Bank and FAO perspective. Marine Policy, 138, 104992.
https://doi.org/10.1016/j.marpol.2022.104992
|
| [15] |
Zhang, W., Belton, B., Edwards, P., Henriksson, P. J. G., Little, D. C., Newton, R., Troell, M., & Phillips, M. J. (2022). Aquaculture will continue to depend on capture fisheries for nutrients. Nature Food, 3(1), 57–63.
https://doi.org/10.1038/s43016-021-00438-6
|
| [16] |
Yamane, T. (1967). Statistics: An introductory analysis (2nd ed.). New York, NY: Harper and Row.
|
Cite This Article
-
APA Style
Alhassan, Y. J., Isreal, T. I., James, C. (2026). Barriers to Livelihood Diversification and Welfare Outcomes of Artisanal Fishing Households Along Shiroro and Kainji Dams, Nigeria. Ecology and Evolutionary Biology, 11(3), 41-50. https://doi.org/10.11648/j.eeb.20261103.11
 Copy
|
Copy
|
 Download
ACS Style
Alhassan, Y. J.; Isreal, T. I.; James, C. Barriers to Livelihood Diversification and Welfare Outcomes of Artisanal Fishing Households Along Shiroro and Kainji Dams, Nigeria. Ecol. Evol. Biol. 2026, 11(3), 41-50. doi: 10.11648/j.eeb.20261103.11
Copy
|
Download
AMA Style
Alhassan YJ, Isreal TI, James C. Barriers to Livelihood Diversification and Welfare Outcomes of Artisanal Fishing Households Along Shiroro and Kainji Dams, Nigeria. Ecol Evol Biol. 2026;11(3):41-50. doi: 10.11648/j.eeb.20261103.11
Copy
|
Download
-
@article{10.11648/j.eeb.20261103.11,
  author = {Yohanna John Alhassan and Tsukutado Istifnus Isreal and Cuba James},
  title = {Barriers to Livelihood Diversification and Welfare Outcomes of Artisanal Fishing Households Along Shiroro and Kainji Dams, Nigeria},
  journal = {Ecology and Evolutionary Biology},
  volume = {11},
  number = {3},
  pages = {41-50},
  doi = {10.11648/j.eeb.20261103.11},
  url = {https://doi.org/10.11648/j.eeb.20261103.11},
  eprint = {https://article.sciencepublishinggroup.com/pdf/10.11648.j.eeb.20261103.11},
  abstract = {This study examined the barriers to livelihood diversification and welfare outcomes of artisanal fishing households along Shiroro and Kainji dams, Nigeria and welfare outcomes of artisanal fishing households along Shiroro and Kainji dams. A cross-sectional survey of 300 fishers across 50 villages was conducted, with data analyzed using Exploratory Factor Analysis (EFA) and the Simpson Diversification Index (SDI). Economic constraints high cost of fishing gear (72.0%), limited access to credit (72.7%), and inadequate operating capital (71.0%) were the most severe factors affecting livelihoods. Institutional challenges, including limited extension services (52.7%) and inadequate training (49.0%), alongside environmental stressors such as seasonal water-level fluctuations (36.3%) and climate variability (36.3%), also influenced outcomes. EFA identified Economic Welfare (Factor 1), comprising fishing income (0.82), income from other activities (0.79), and household expenditure (0.75), as the most influential determinant of well-being. Access to services (Factor 2), Food Security (Factor 3), and Asset Ownership (Factor 4) further shaped household welfare. Livelihood diversification was high (SDI = 0.955), dominated by arable farming (59.3%), poultry (50.2%), and livestock (45.9%) and supplemented by petty trading, night guarding, and small-scale processing. The study concludes that diversified livelihoods help households mitigate risks from declining fish stocks and environmental variability. Policy interventions promoting financial inclusion, access to affordable inputs, institutional support, and market development are essential for sustaining welfare and fostering resilient artisanal fisheries.},
 year = {2026}
}
Copy
|
Download
-
TY  - JOUR
T1  - Barriers to Livelihood Diversification and Welfare Outcomes of Artisanal Fishing Households Along Shiroro and Kainji Dams, Nigeria
AU  - Yohanna John Alhassan
AU  - Tsukutado Istifnus Isreal
AU  - Cuba James
Y1  - 2026/08/17
PY  - 2026
N1  - https://doi.org/10.11648/j.eeb.20261103.11
DO  - 10.11648/j.eeb.20261103.11
T2  - Ecology and Evolutionary Biology
JF  - Ecology and Evolutionary Biology
JO  - Ecology and Evolutionary Biology
SP  - 41
EP  - 50
PB  - Science Publishing Group
SN  - 2575-3762
UR  - https://doi.org/10.11648/j.eeb.20261103.11
AB  - This study examined the barriers to livelihood diversification and welfare outcomes of artisanal fishing households along Shiroro and Kainji dams, Nigeria and welfare outcomes of artisanal fishing households along Shiroro and Kainji dams. A cross-sectional survey of 300 fishers across 50 villages was conducted, with data analyzed using Exploratory Factor Analysis (EFA) and the Simpson Diversification Index (SDI). Economic constraints high cost of fishing gear (72.0%), limited access to credit (72.7%), and inadequate operating capital (71.0%) were the most severe factors affecting livelihoods. Institutional challenges, including limited extension services (52.7%) and inadequate training (49.0%), alongside environmental stressors such as seasonal water-level fluctuations (36.3%) and climate variability (36.3%), also influenced outcomes. EFA identified Economic Welfare (Factor 1), comprising fishing income (0.82), income from other activities (0.79), and household expenditure (0.75), as the most influential determinant of well-being. Access to services (Factor 2), Food Security (Factor 3), and Asset Ownership (Factor 4) further shaped household welfare. Livelihood diversification was high (SDI = 0.955), dominated by arable farming (59.3%), poultry (50.2%), and livestock (45.9%) and supplemented by petty trading, night guarding, and small-scale processing. The study concludes that diversified livelihoods help households mitigate risks from declining fish stocks and environmental variability. Policy interventions promoting financial inclusion, access to affordable inputs, institutional support, and market development are essential for sustaining welfare and fostering resilient artisanal fisheries.
VL  - 11
IS  - 3
ER  -
Copy
|
Download





 Share This Article
 Twitter
 Linked In
 Facebook